Overfitting in EAs: Why Perfect Backtests Fail Live
Every trader who has spent time in a strategy tester has produced an EA with a beautiful equity curve. Almost none of those curves survive live trading unchanged. The gap between a spectacular backtest and a mediocre live account is usually not bad luck. It is overfitting: parameters tuned so precisely to past data that they no longer describe anything about the market, only the specific noise of the sample. This guide explains what overfitting and curve fitting actually are, why they are so easy to produce accidentally, and how to test whether an EA has a real edge or an imaginary one.
Overfitting and Curve Fitting Defined
The two terms are often used interchangeably but have slightly different flavours.
Curve fitting is adjusting an EA’s parameters until its historical equity curve looks as smooth and profitable as possible.
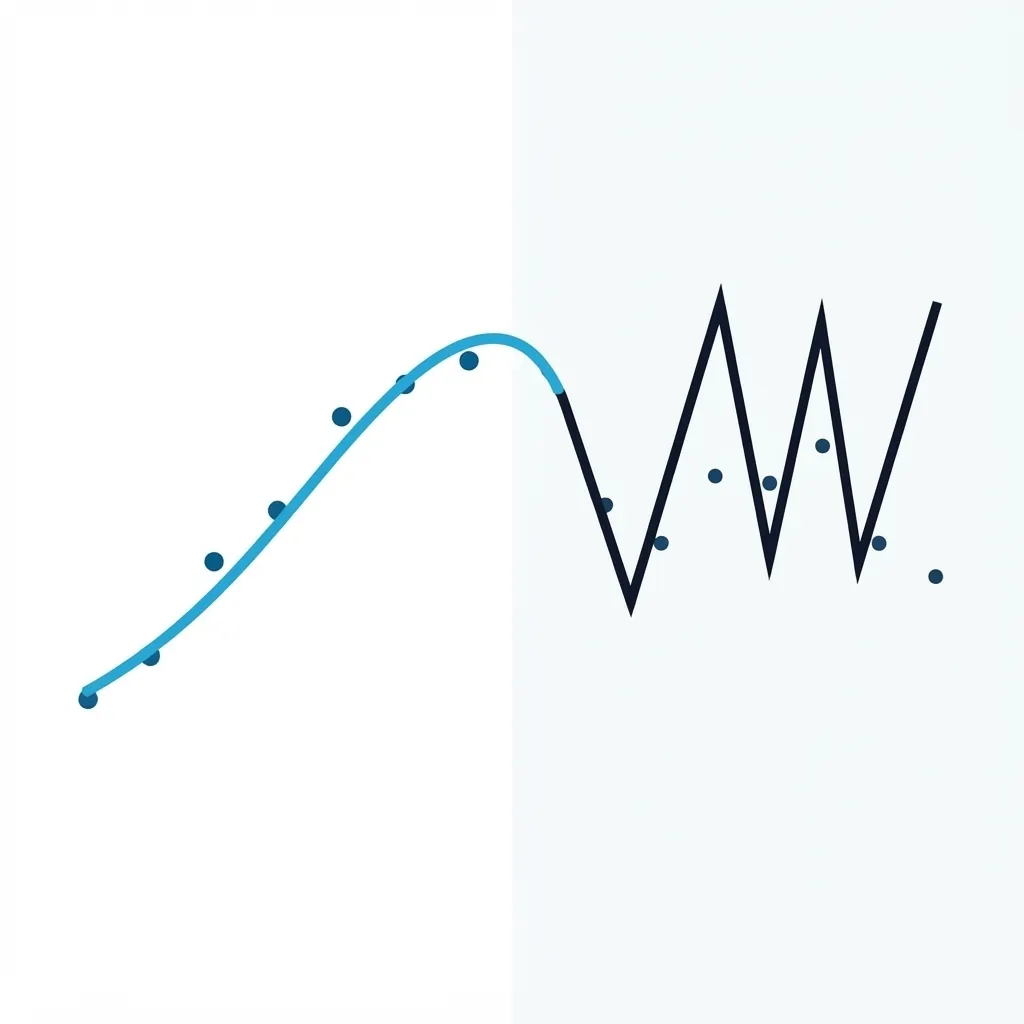
Overfitting is the resulting statistical problem: the parameters fit the noise of the sample rather than a persistent market feature.
A curve-fitted EA describes the past perfectly and predicts the future poorly. That is the single sentence that captures why most impressive backtests underperform when money is on the line.
Why It Is So Easy to Produce Accidentally
The MetaTrader Strategy Tester makes optimisation trivial. A trader with no bad intent can:
Backtest an EA on 5 years of EURUSD.
Run a genetic optimisation on 12 parameters.
Pick the combination with the best net profit.
Show a screenshot that looks compelling.
None of those steps are wrong in isolation. Together they are a factory for overfitted systems. Every additional parameter, every additional degree of freedom, is another chance to fit random price movements from history.
MetaQuotes describes the tester as a tool to test and optimise strategies before live trading, and its official Strategy Tester documentation explicitly notes that optimisation runs the strategy multiple times with different parameter sets to find the most appropriate combination. That is powerful and dangerous in equal measure.
The Warning Signs of a Curve-Fitted EA
Warning sign | What it usually means |
|---|---|
Very high number of parameters (10+) | Many degrees of freedom to fit noise |
Perfectly smooth equity curve | Real markets are not this smooth |
Great performance on one pair, poor on similar pairs | Fitted to that pair’s specific history |
Great performance in one date range, poor just outside it | Fitted to that regime |
No out-of-sample test shown | Optimiser saw the entire sample |
Parameter values look strangely specific (e.g. RSI period 27, not 14 or 30) | Product of an optimisation search, not logic |
Sensitive to tiny parameter changes | Not a robust edge |
A robust EA typically shows moderate performance across many parameter combinations near the chosen one, not a razor-thin spike at exactly one setting.
Our free EA Red Flag Checklist includes these signs alongside the vendor and track-record questions, so you can run a specific product through all of them in one pass.
Related Structural Problems
Selection bias. Developers only ship the strategies that survived their own experiments. You never see the failures.
Look-ahead bias. The EA uses data that was not available at the time of the trade, such as future-closing bar values.
Data snooping. Reusing the same historical sample for many rounds of iteration until something works by chance.
Broker-specific fit. Optimised to one broker’s spreads and slippage in a way that will not generalise.
Any of these can produce an equity curve that looks like alpha but is really artefact.
How to Test for Robustness
The standard tools for detecting overfitting are simple in principle and often skipped in practice.
Out-of-sample split. Reserve 20-30% of the data as an untouched hold-out. Optimise on the rest. If the hold-out matches, the edge is more likely real.
Walk-forward analysis. Repeatedly optimise on a rolling in-sample window and test on the immediately following out-of-sample window. Consistency across windows is the goal.
Multi-instrument testing. If the EA works on EURUSD but breaks on GBPUSD and USDJPY with the same parameters, the edge is instrument-specific fit rather than a genuine pattern.
Parameter sensitivity. Vary each parameter slightly around the chosen value. A robust EA should degrade gracefully; a fitted one collapses.
Monte Carlo shuffling. Randomise trade order and slippage to see how the equity curve reacts. Fitted systems produce very unstable distributions.
Forward test. Run the finalised EA on a demo or micro-live account for at least a few months. Forward tests use unseen data by definition.
Our earlier explainer on why past results do not guarantee future performance covers the broader statistical context that makes overfitting so common in backtest-driven marketing.
The Relationship With Drawdown
Curve-fitted EAs often show unrealistically low backtest drawdown because the parameters have been chosen to smooth out the exact losses that would otherwise appear. That is not risk management; it is retrospective avoidance. Live trading almost always reveals a much larger drawdown than the fitted backtest suggests. If a published EA shows a maximum drawdown that looks too clean, that alone is a signal to dig deeper. Our companion piece on evaluating EA drawdown risks explains how to read drawdown numbers with appropriate scepticism.
Reducing Overfitting in Your Own Work
If you optimise EAs yourself, a few disciplines meaningfully reduce risk:
Choose fewer, more meaningful parameters. Every extra parameter is a liability.
Fix parameters that have no theoretical reason to change, rather than optimising them.
Use walk-forward as the default, not the exception.
Prefer parameter values chosen for reasons you can explain, not just because they scored best.
Judge candidates on their worst window, not their best.
Reject candidates that only work on one instrument or one date range.
FAQ
Is any backtest curve fitting to some degree?
Yes. All parameter selection touches the data. The question is how much and whether it survives out of sample.
Can machine-learning EAs be curve fitted?
Absolutely. In fact ML models have even more degrees of freedom and often overfit more severely without proper validation.
Does a 10-year backtest solve the problem?
Length helps but does not solve it. Long backtests still contain limited regimes and can still be overfitted.
What is a healthy trade count for a backtest?
Hundreds to thousands, ideally covering different volatility conditions.
Should I only trust EAs with a long live track record?
Live results are usually more informative than any backtest. A track record on a verified live account is the strongest signal.
Can walk-forward analysis prove an EA works?
No. It can only make overfitting less likely. Nothing proves future performance.
Trading foreign exchange and CFDs on margin carries a high level of risk and may not be suitable for all investors. This article is for educational purposes only and does not constitute financial advice.
Look Beyond the Backtest Curve
An impressive backtest is a starting point, not a decision. How we test Expert Advisors sets out the specific checks we apply before we treat any backtest as evidence, and our independently vetted Expert Advisors page shows which products have cleared them.